安装EFK插件
我们通过在每台node上部署一个以DaemonSet方式运行的fluentd来收集每台node上的日志。Fluentd将docker日志目录/var/lib/docker/containers和/var/log目录挂载到Pod中,然后Pod会在node节点的/var/log/pods目录中创建新的目录,可以区别不同的容器日志输出,该目录下有一个日志文件链接到/var/lib/docker/contianers目录下的容器日志输出。
官方文件目录:cluster/addons/fluentd-elasticsearch
$ ls *.yaml
es-controller.yaml  es-service.yaml  fluentd-es-ds.yaml  kibana-controller.yaml  kibana-service.yaml efk-rbac.yaml
同样EFK服务也需要一个efk-rbac.yaml文件,配置serviceaccount为efk。
已经修改好的 yaml 文件见:../manifests/EFK
配置 es-controller.yaml
$ diff es-controller.yaml.orig es-controller.yaml
24c24
<       - image: gcr.io/google_containers/elasticsearch:v2.4.1-2
---
>       - image: harbor-001.jimmysong.io/library/elasticsearch:v2.4.1-2
配置 es-service.yaml
无需配置;
配置 fluentd-es-ds.yaml
$ diff fluentd-es-ds.yaml.orig fluentd-es-ds.yaml
26c26
<         image: gcr.io/google_containers/fluentd-elasticsearch:1.22
---
>         image: harbor-001.jimmysong.io/library/fluentd-elasticsearch:1.22
配置 kibana-controller.yaml
$ diff kibana-controller.yaml.orig kibana-controller.yaml
22c22
<         image: gcr.io/google_containers/kibana:v4.6.1-1
---
>         image: harbor-001.jimmysong.io/library/kibana:v4.6.1-1
给 Node 设置标签
定义 DaemonSet fluentd-es-v1.22 时设置了 nodeSelector beta.kubernetes.io/fluentd-ds-ready=true ,所以需要在期望运行 fluentd 的 Node 上设置该标签;
$ kubectl get nodes
NAME        STATUS    AGE       VERSION
172.20.0.113   Ready     1d        v1.6.0

$ kubectl label nodes 172.20.0.113 beta.kubernetes.io/fluentd-ds-ready=true
node "172.20.0.113" labeled
给其他两台node打上同样的标签。
执行定义文件
$ kubectl create -f .
serviceaccount "efk" created
clusterrolebinding "efk" created
replicationcontroller "elasticsearch-logging-v1" created
service "elasticsearch-logging" created
daemonset "fluentd-es-v1.22" created
deployment "kibana-logging" created
service "kibana-logging" created
检查执行结果
$ kubectl get deployment -n kube-system|grep kibana
kibana-logging         1         1         1            1           2m

$ kubectl get pods -n kube-system|grep -E 'elasticsearch|fluentd|kibana'
elasticsearch-logging-v1-mlstp          1/1       Running   0          1m
elasticsearch-logging-v1-nfbbf          1/1       Running   0          1m
fluentd-es-v1.22-31sm0                  1/1       Running   0          1m
fluentd-es-v1.22-bpgqs                  1/1       Running   0          1m
fluentd-es-v1.22-qmn7h                  1/1       Running   0          1m
kibana-logging-1432287342-0gdng         1/1       Running   0          1m

$ kubectl get service  -n kube-system|grep -E 'elasticsearch|kibana'
elasticsearch-logging   10.254.77.62    <none>        9200/TCP                        2m
kibana-logging          10.254.8.113    <none>        5601/TCP                        2m
kibana Pod 第一次启动时会用较长时间(10-20分钟)来优化和 Cache 状态页面,可以 tailf 该 Pod 的日志观察进度:
$ kubectl logs kibana-logging-1432287342-0gdng -n kube-system -f
ELASTICSEARCH_URL=http://elasticsearch-logging:9200
server.basePath: /api/v1/proxy/namespaces/kube-system/services/kibana-logging
{"type":"log","@timestamp":"2017-04-12T13:08:06Z","tags":["info","optimize"],"pid":7,"message":"Optimizing and caching bundles for kibana and statusPage. This may take a few minutes"}
{"type":"log","@timestamp":"2017-04-12T13:18:17Z","tags":["info","optimize"],"pid":7,"message":"Optimization of bundles for kibana and statusPage complete in 610.40 seconds"}
{"type":"log","@timestamp":"2017-04-12T13:18:17Z","tags":["status","plugin:[email protected]","info"],"pid":7,"state":"green","message":"Status changed from uninitialized to green - Ready","prevState":"uninitialized","prevMsg":"uninitialized"}
{"type":"log","@timestamp":"2017-04-12T13:18:18Z","tags":["status","plugin:[email protected]","info"],"pid":7,"state":"yellow","message":"Status changed from uninitialized to yellow - Waiting for Elasticsearch","prevState":"uninitialized","prevMsg":"uninitialized"}
{"type":"log","@timestamp":"2017-04-12T13:18:19Z","tags":["status","plugin:[email protected]","info"],"pid":7,"state":"green","message":"Status changed from uninitialized to green - Ready","prevState":"uninitialized","prevMsg":"uninitialized"}
{"type":"log","@timestamp":"2017-04-12T13:18:19Z","tags":["status","plugin:[email protected]","info"],"pid":7,"state":"green","message":"Status changed from uninitialized to green - Ready","prevState":"uninitialized","prevMsg":"uninitialized"}
{"type":"log","@timestamp":"2017-04-12T13:18:19Z","tags":["status","plugin:[email protected]","info"],"pid":7,"state":"green","message":"Status changed from uninitialized to green - Ready","prevState":"uninitialized","prevMsg":"uninitialized"}
{"type":"log","@timestamp":"2017-04-12T13:18:19Z","tags":["status","plugin:[email protected]","info"],"pid":7,"state":"green","message":"Status changed from uninitialized to green - Ready","prevState":"uninitialized","prevMsg":"uninitialized"}
{"type":"log","@timestamp":"2017-04-12T13:18:19Z","tags":["status","plugin:[email protected]","info"],"pid":7,"state":"green","message":"Status changed from uninitialized to green - Ready","prevState":"uninitialized","prevMsg":"uninitialized"}
{"type":"log","@timestamp":"2017-04-12T13:18:19Z","tags":["status","plugin:[email protected]","info"],"pid":7,"state":"green","message":"Status changed from uninitialized to green - Ready","prevState":"uninitialized","prevMsg":"uninitialized"}
{"type":"log","@timestamp":"2017-04-12T13:18:19Z","tags":["listening","info"],"pid":7,"message":"Server running at http://0.0.0.0:5601"}
{"type":"log","@timestamp":"2017-04-12T13:18:24Z","tags":["status","plugin:[email protected]","info"],"pid":7,"state":"yellow","message":"Status changed from yellow to yellow - No existing Kibana index found","prevState":"yellow","prevMsg":"Waiting for Elasticsearch"}
{"type":"log","@timestamp":"2017-04-12T13:18:29Z","tags":["status","plugin:[email protected]","info"],"pid":7,"state":"green","message":"Status changed from yellow to green - Kibana index ready","prevState":"yellow","prevMsg":"No existing Kibana index found"}
访问 kibana
通过 kube-apiserver 访问:
获取 monitoring-grafana 服务 URL
 $ kubectl cluster-info
 Kubernetes master is running at https://172.20.0.113:6443
 Elasticsearch is running at https://172.20.0.113:6443/api/v1/proxy/namespaces/kube-system/services/elasticsearch-logging
 Heapster is running at https://172.20.0.113:6443/api/v1/proxy/namespaces/kube-system/services/heapster
 Kibana is running at https://172.20.0.113:6443/api/v1/proxy/namespaces/kube-system/services/kibana-logging
 KubeDNS is running at https://172.20.0.113:6443/api/v1/proxy/namespaces/kube-system/services/kube-dns
 kubernetes-dashboard is running at https://172.20.0.113:6443/api/v1/proxy/namespaces/kube-system/services/kubernetes-dashboard
 monitoring-grafana is running at https://172.20.0.113:6443/api/v1/proxy/namespaces/kube-system/services/monitoring-grafana
 monitoring-influxdb is running at https://172.20.0.113:6443/api/v1/proxy/namespaces/kube-system/services/monitoring-influxdb
浏览器访问 URL:
https://172.20.0.113:6443/api/v1/proxy/namespaces/kube-system/services/kibana-logging/app/kibana通过 kubectl proxy 访问:
创建代理
 $ kubectl proxy --address='172.20.0.113' --port=8086 --accept-hosts='^*$'
 Starting to serve on 172.20.0.113:8086
浏览器访问 URL:
http://172.20.0.113:8086/api/v1/proxy/namespaces/kube-system/services/kibana-logging
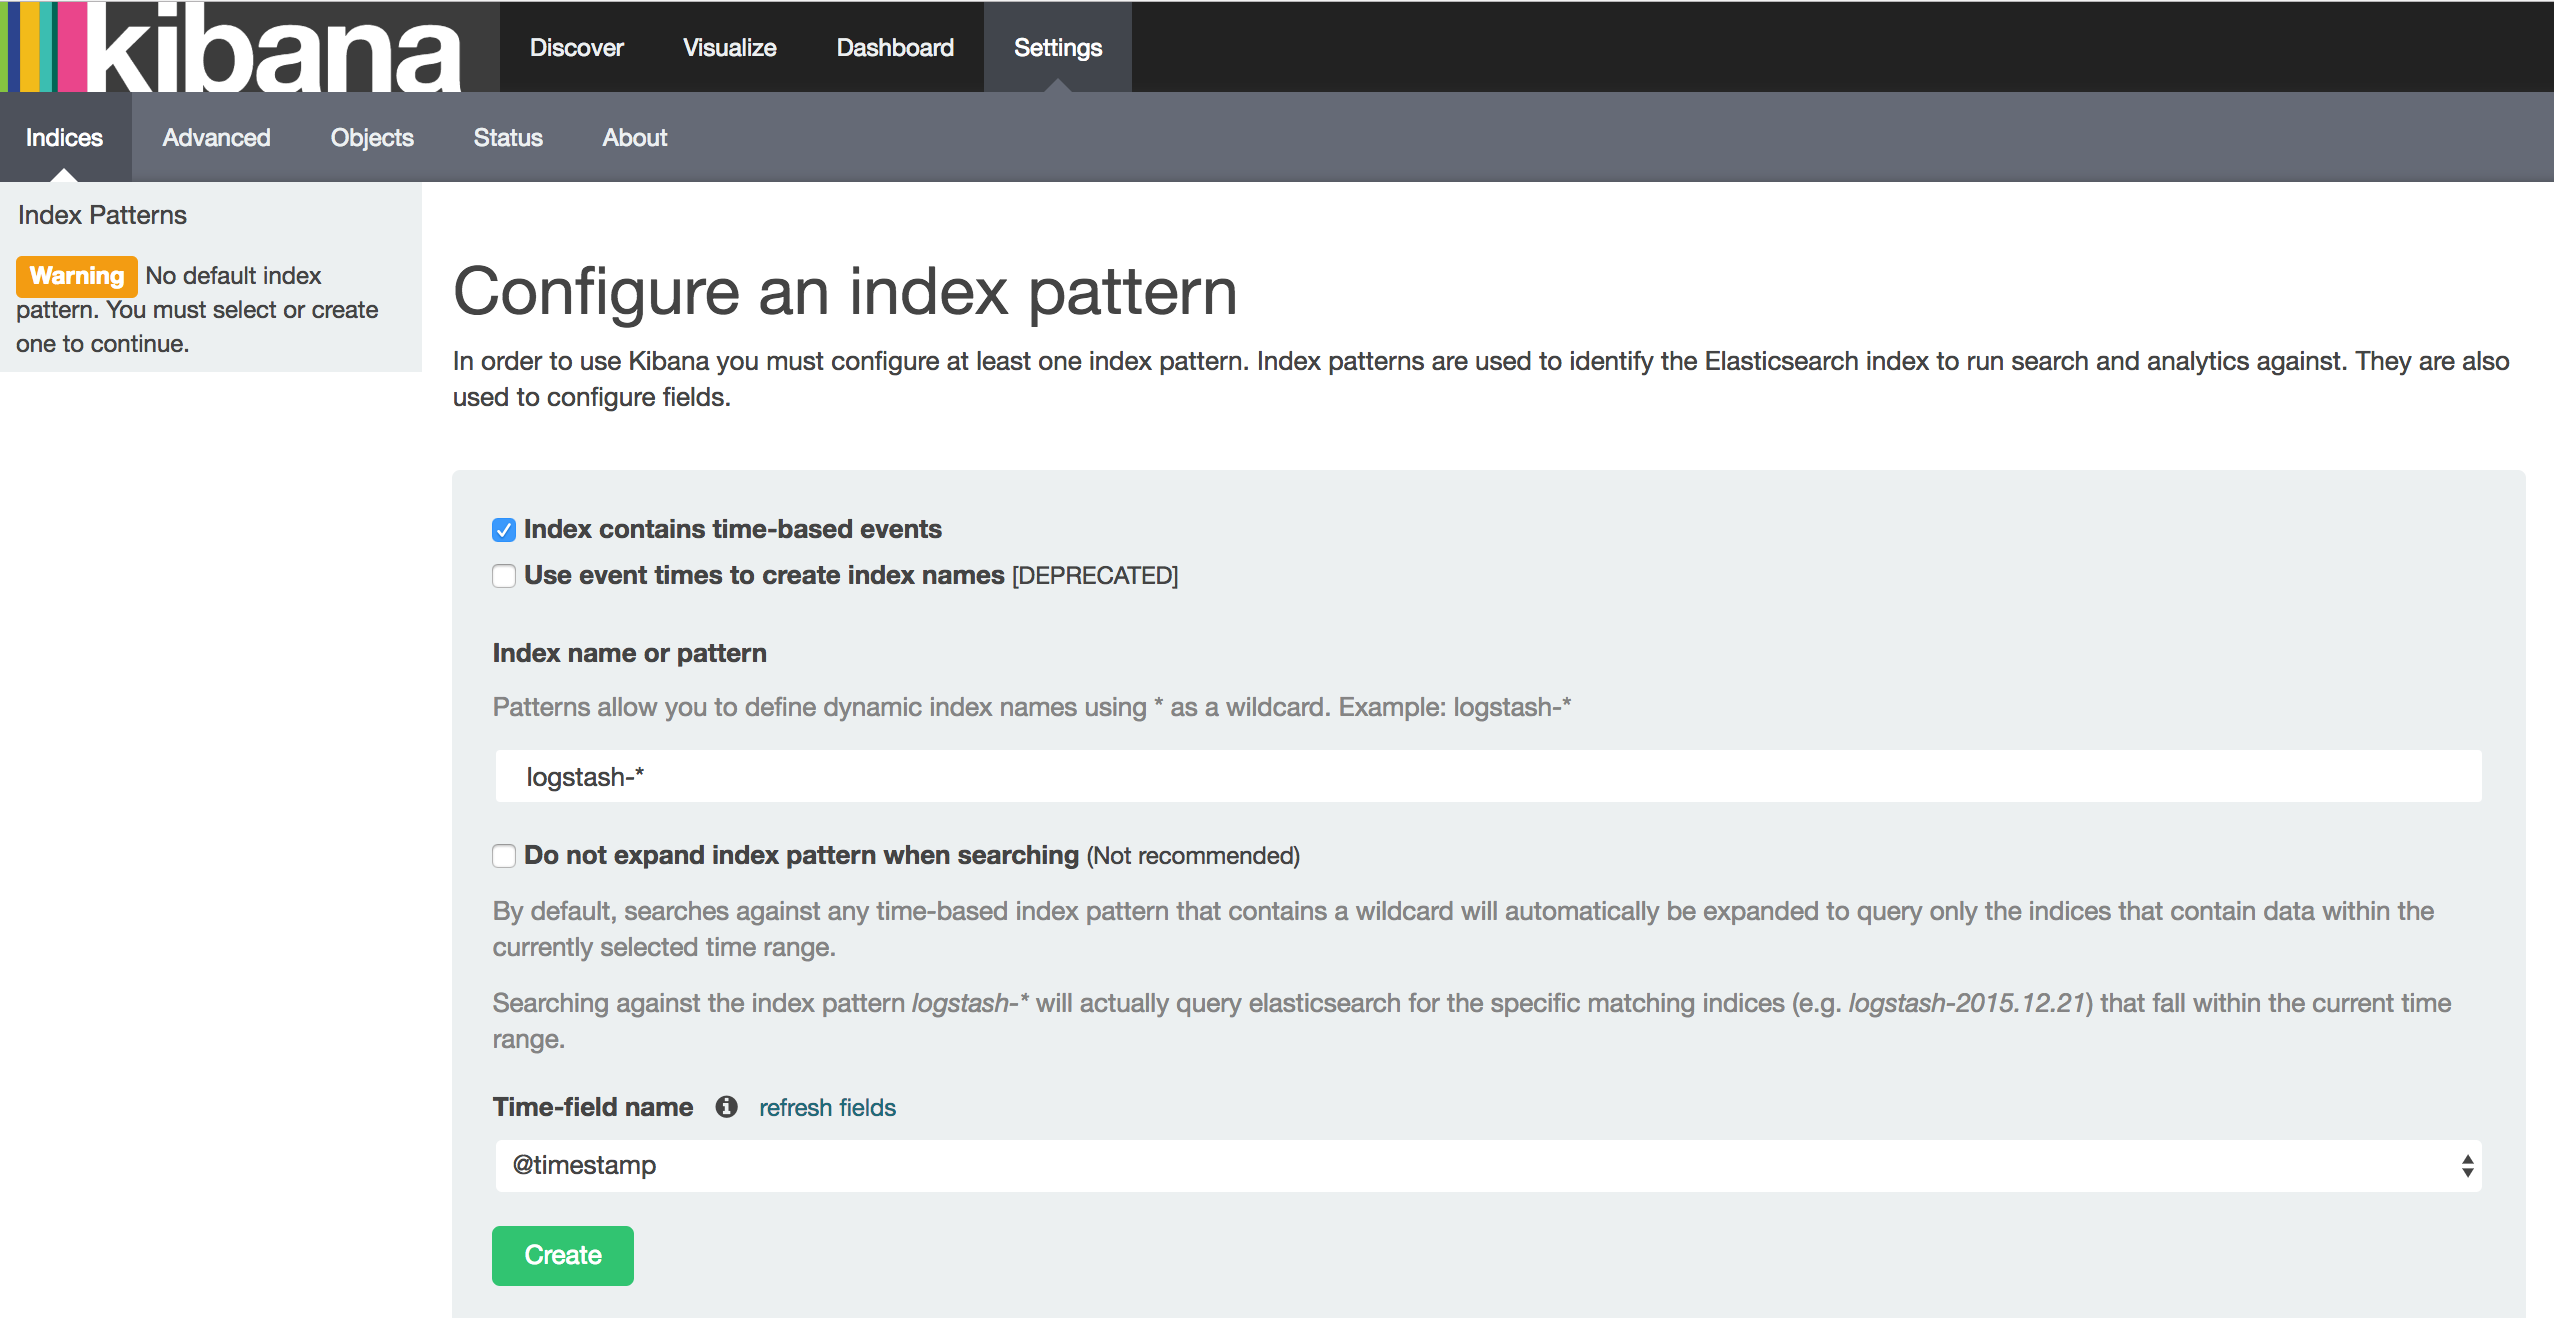
在 Settings -> Indices 页面创建一个 index(相当于 mysql 中的一个 database),选中 Index contains time-based events,使用默认的 logstash-* pattern,点击 Create ;
可能遇到的问题
如果你在这里发现Create按钮是灰色的无法点击,且Time-filed name中没有选项,fluentd要读取/var/log/containers/目录下的log日志,这些日志是从/var/lib/docker/containers/${CONTAINER_ID}/${CONTAINER_ID}-json.log链接过来的,查看你的docker配置,—log-dirver需要设置为json-file格式,默认的可能是journald,参考docker logging。

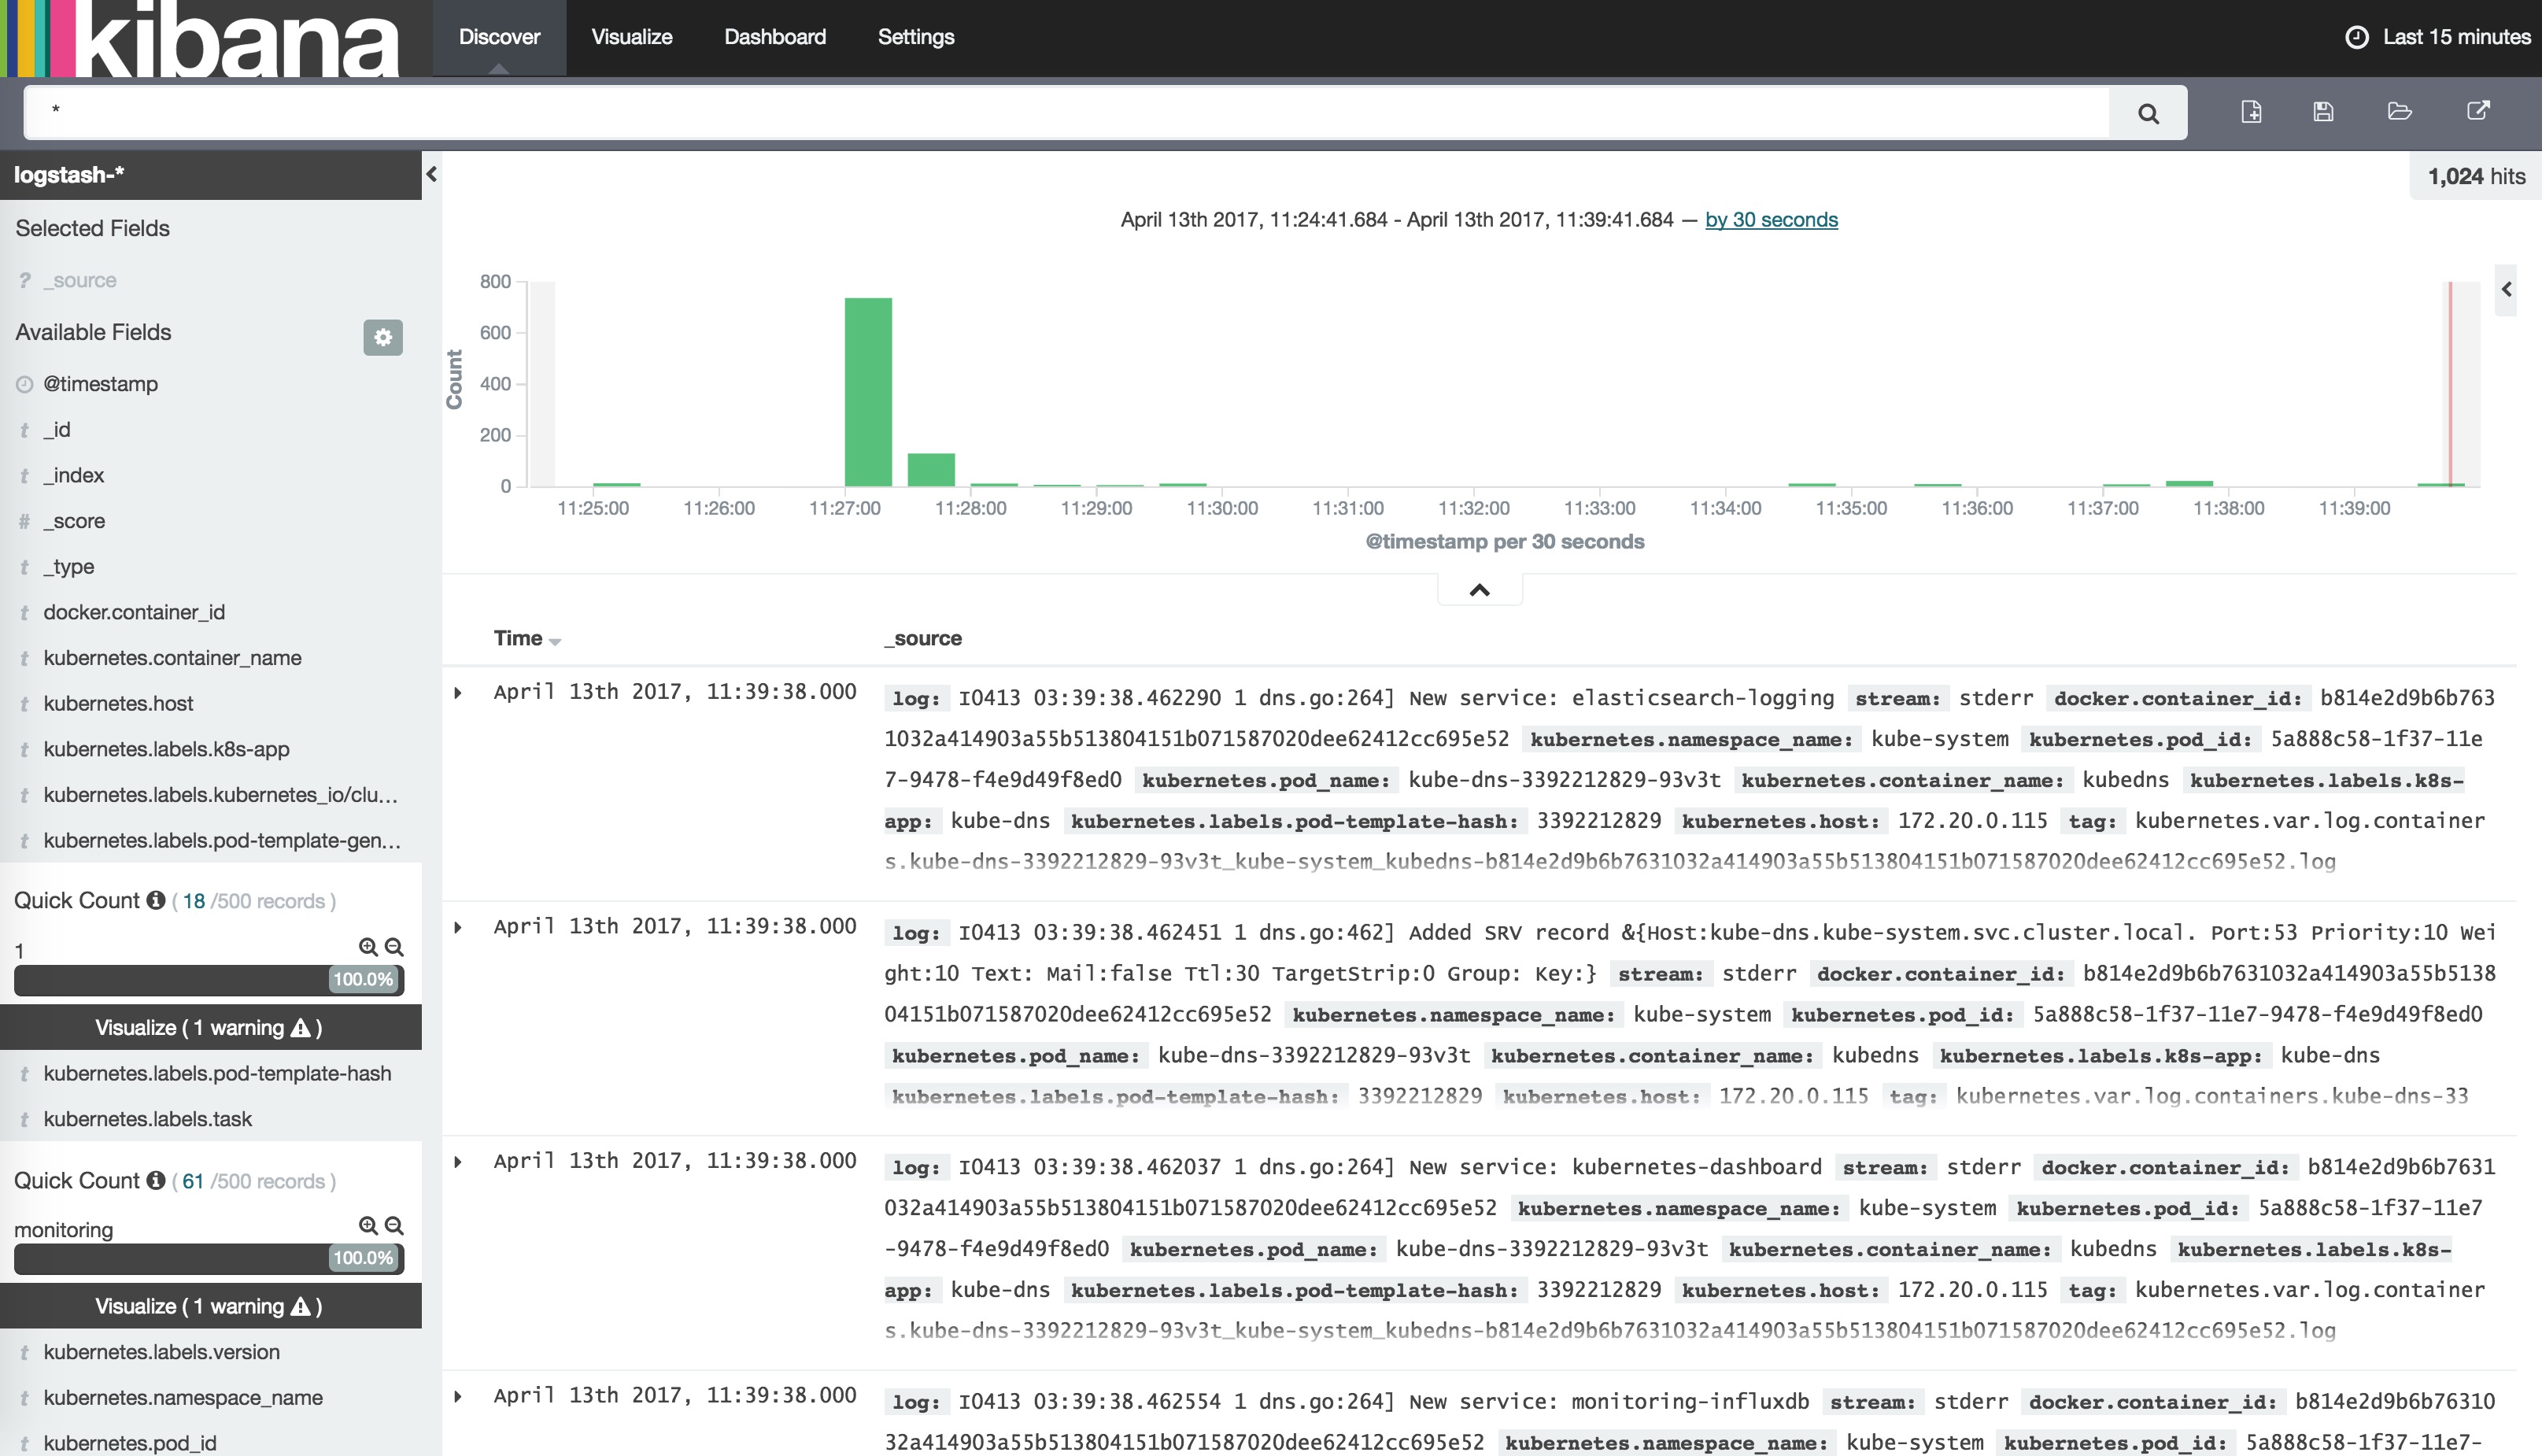
创建Index后,可以在 Discover 下看到 ElasticSearch logging 中汇聚的日志;
